
Videos: Sicily Battles More Than 1,000 Wildfires as Temperatures Soar Above 45°C
Firefighters across Sicily are battling hundreds of wildfires as extreme heat, prolonged…

Canada Deploys Military to Evacuate Remote Community as Wildfires Continue to Spread
Canada's military is preparing to evacuate residents from a remote community in…

Spain Wildfire Tragedy: 12 Dead as Massive Blaze Sweeps Through Andalusia
Fast-moving wildfire near Almería claims 12 lives amid extreme heat as firefighters…
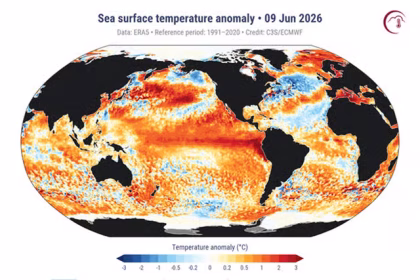
“Godzilla” El Niño Could Become One of the Strongest Ever Recorded, Raising Global Fears of Extreme Weather
Meteorologists are warning that a rapidly strengthening El Niño in the Pacific…

Could a “Super El Niño” Trigger Extreme Weather Across the United States?
Meteorologists are closely monitoring the Pacific Ocean as signs continue to point…

What Would Earth Look Like If All the Ice Melted?
Beneath the frozen landscapes of Greenland, Antarctica, and the world’s glaciers lies…

Climate Warning: Atlantic Current System Could Collapse – What It Means for Europe
A new study warns that the Atlantic Ocean circulation system could collapse,…

Climate shift warning: Hurricanes may expand toward major global cities
New study reveals growing risk for mid-latitude regions A new study led…

What La Niña Will Do to Earth in 2025
In 2025, scientists are closely monitoring the El Niño–Southern Oscillation (ENSO) cycle.…

A23a Megaberg Disintegrating After Nearly 40 Years — Could Vanish in Weeks
Since calving off Antarctica’s Filchner–Ronne Ice Shelf in 1986, the colossal iceberg…
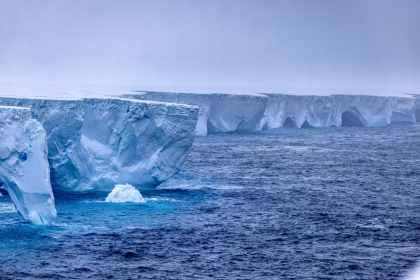
World’s biggest iceberg breaks up after 40 years
Nearly 40 years after breaking off Antarctica, a colossal iceberg ranked among…

What If Sea Levels Suddenly Rose 500 Meters?
There’s a new natural disaster in town. Sea levels have suddenly shot…
